Sentry
Open in the new tab
Databend provides integration with both Cloud and self-hosted Sentry solutions. The following tutorial walks you through the integration process.
Tutorial: Monitor Databend with Sentry
Step 1. Deploy Sentry
To deploy an on-premises Sentry, follow the instructions:
Open in the new tab
This tutorial uses the Sentry service on the cloud. To sign up an account for Cloud Sentry, go to
Open in the new tab
Step 2. Create a Sentry Project
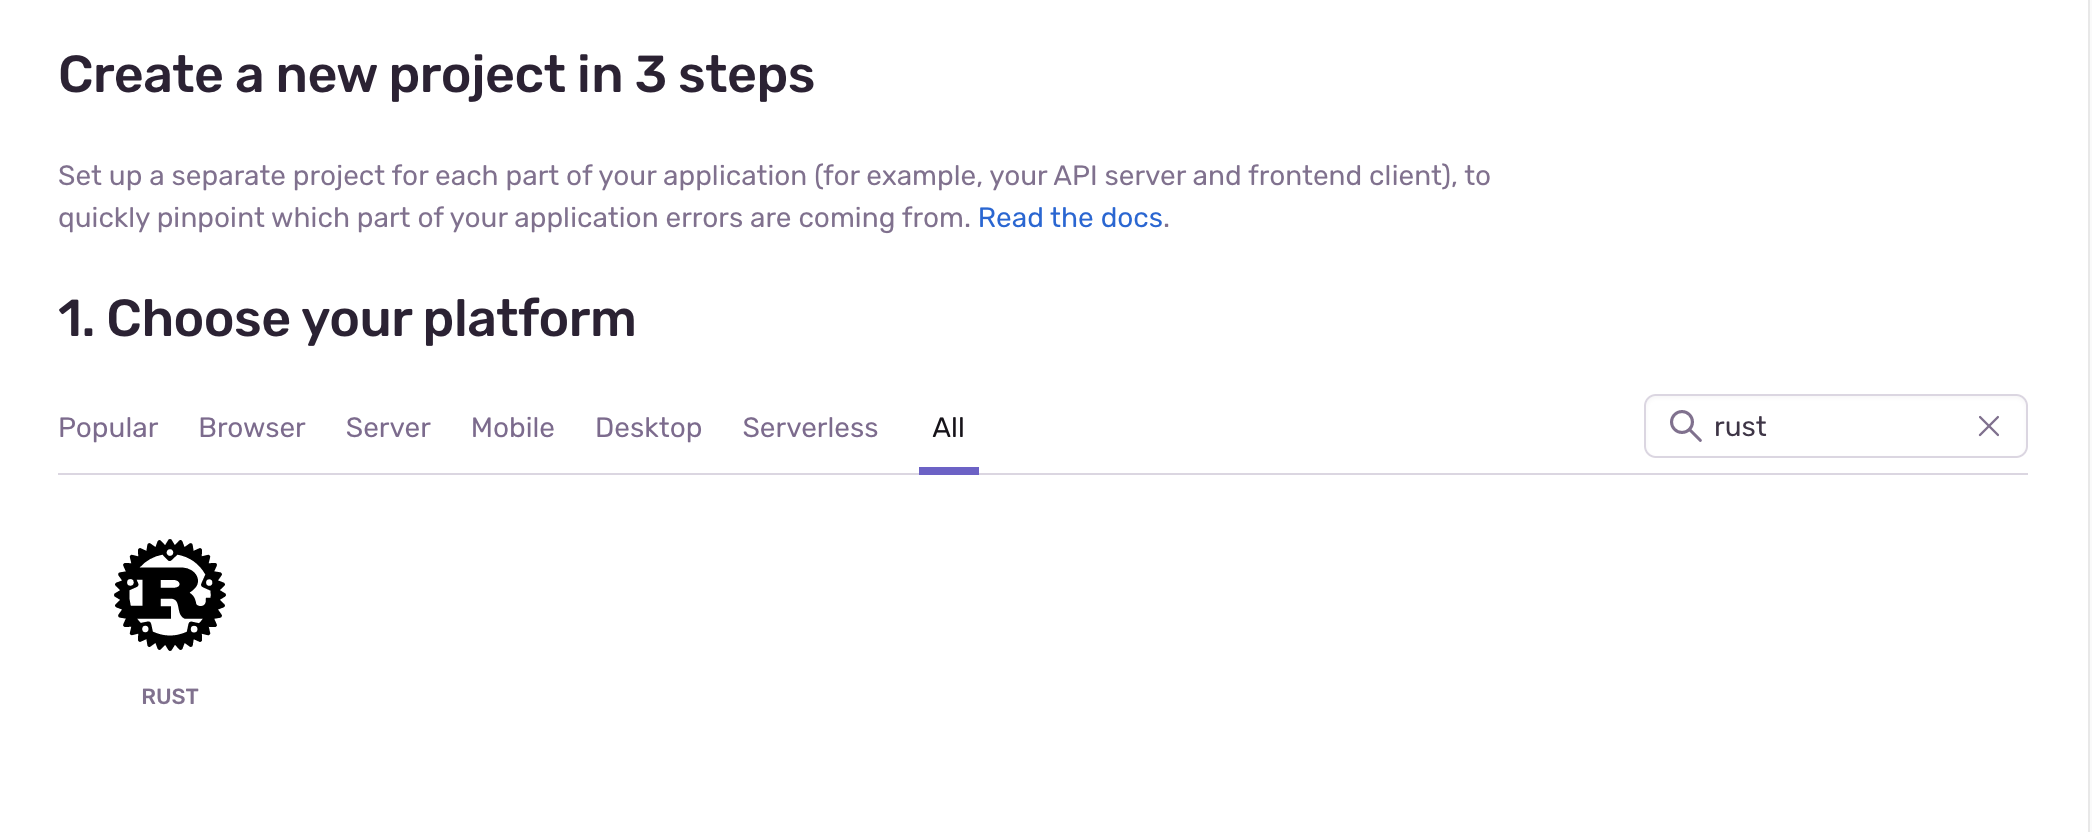
Once you're logged into Sentry, create a Sentry project for the Rust platform to start. For how to create a project on Sentry, see
Open in the new tab

Step 3. Set Environment Variables
Get the DSN (Data Source Name) of your project. For what DSN is and where to find it, see
Open in the new tabSet environment variables.
- To enable the error-tracking feature, run the following commands:
export DATABEND_SENTRY_DSN="<your-DSN>"
- To enable the performance monitoring feature, run the following commands:
export DATABEND_SENTRY_DSN="<your-DSN>"
export SENTRY_TRACES_SAMPLE_RATE=1.0 LOG_LEVEL=DEBUG
tip
Set SENTRY_TRACES_SAMPLE_RATE to a small value in production.
Step 4. Deploy Databend
Follow the
Open in the new tab
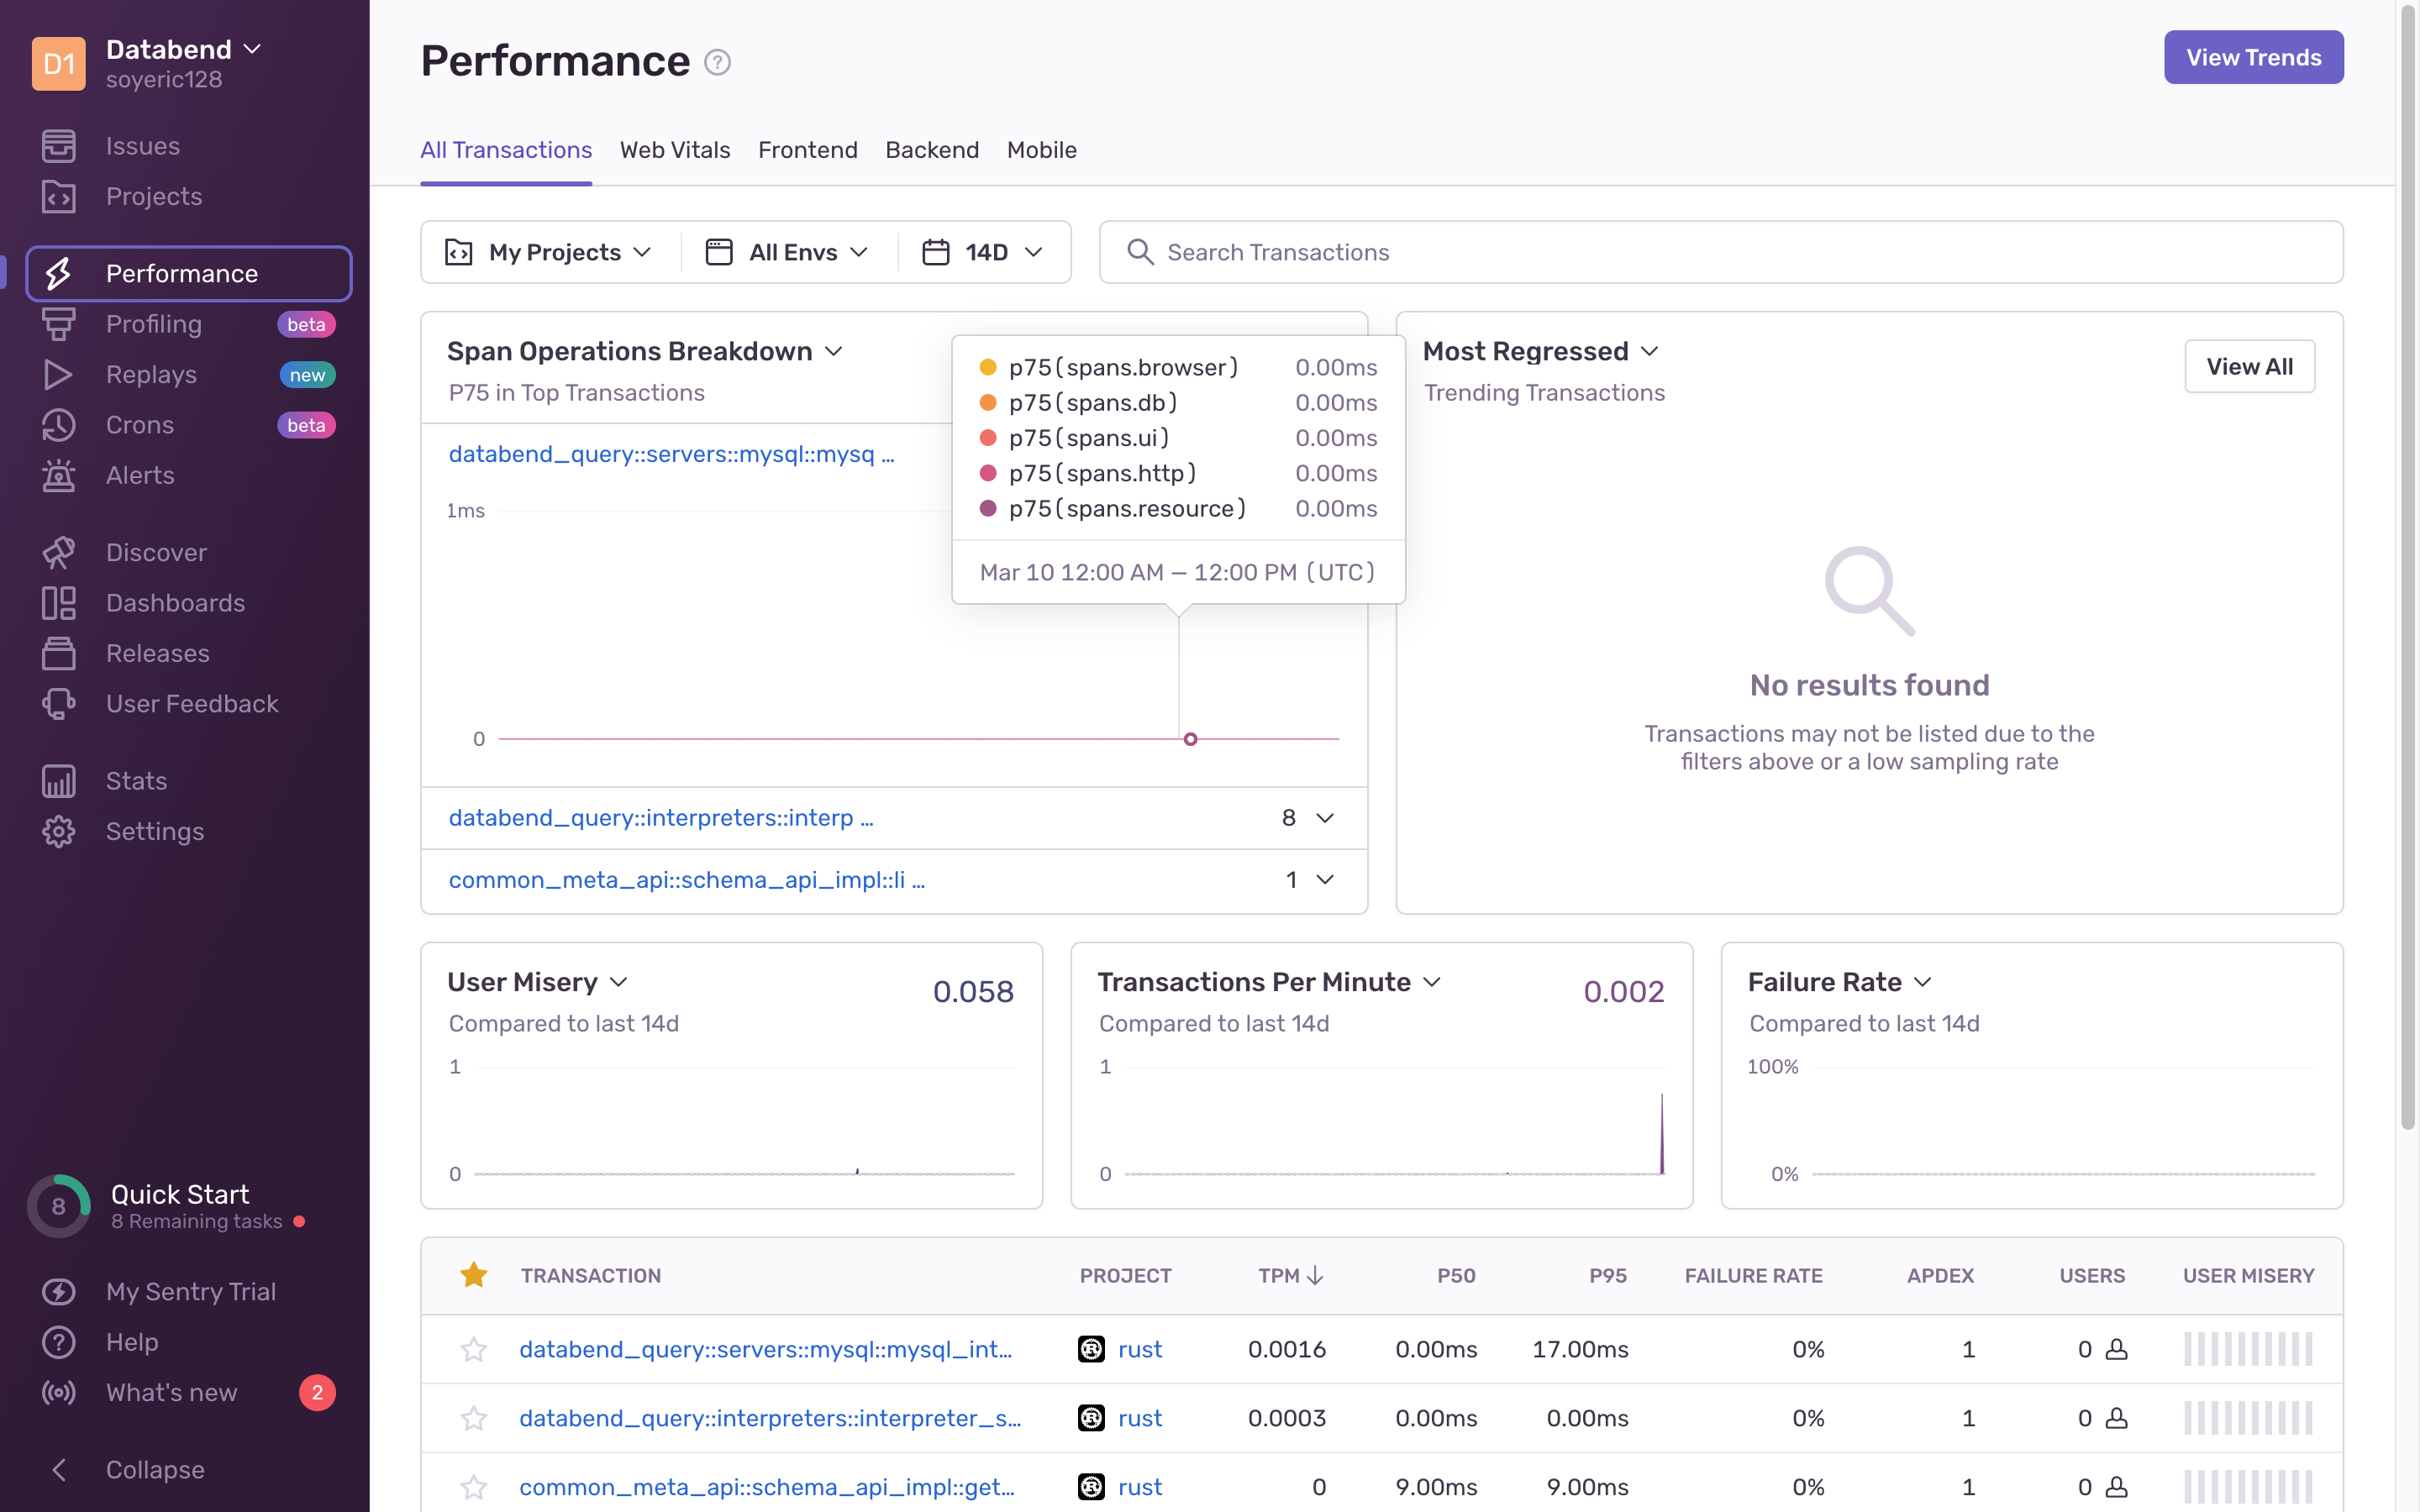
You're all set now. Check the pages on Sentry for alerts and performance information.
